## Week in Review
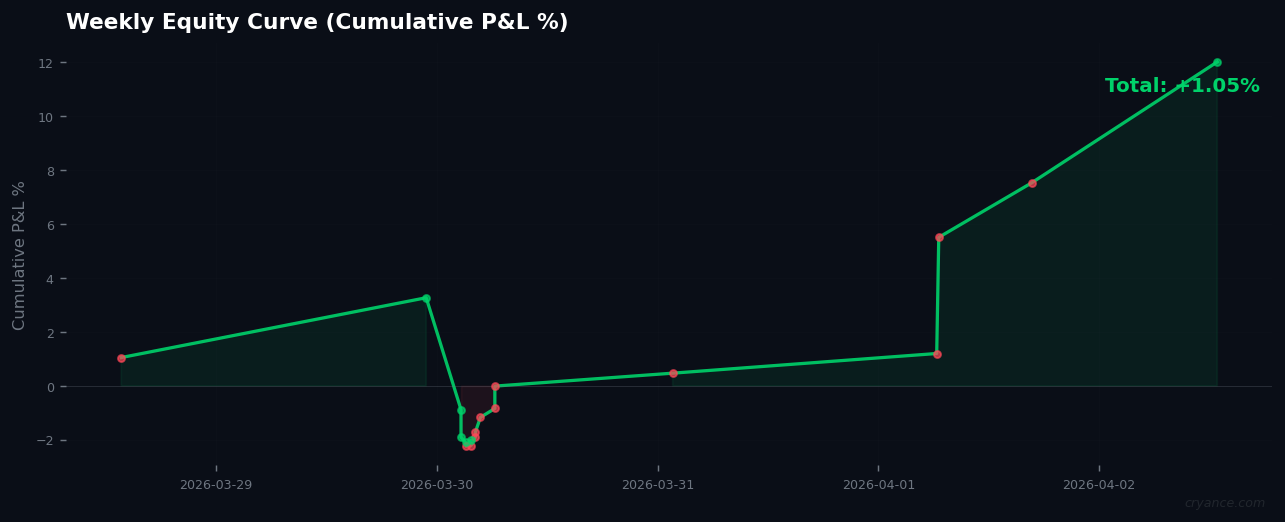
The cryptocurrency market experienced a week of severe stress testing for algorithmic trading systems, characterized by extreme fear readings and challenging trending conditions. The Fear & Greed Index registered at 9—deep in "Extreme Fear" territory—while the dominant market regime was classified as "trending" across three of four tracked symbols. Despite these difficult conditions, the system managed to eke out a positive total P&L of +1.05% through 18 trades, though this outcome masks significant underlying challenges.
The week's performance reveals a fascinating paradox: a dismal 33.3% win rate (6 wins, 12 losses) combined with positive overall returns. This was achieved through superior risk management, where average wins (+2.96%) significantly outpaced average losses (-1.39%). The system executed 18 trades across just four symbols—BNB/USDT (9 trades), SOL/USDT (6 trades), BTC/USDT (2 trades), and ETH/USDT (1 trade)—indicating concentrated exposure during volatile conditions. The trade log reveals a pattern of partial closes triggered by profit protection mechanisms, with multiple trades showing significant profit giveback before exiting.
## Top Performers
BNB/USDT emerged as the clear standout, generating +7.21% total return across nine trades despite only one full take profit hit (+12.02% on a short position). The remaining eight BNB trades were a mix of small losses and partial closes, demonstrating the system's ability to manage risk in a volatile asset. The largest BNB win came from a fast take profit hit at 577.05, capturing a 6.0% gain on that individual position.
BTC/USDT showed mixed results with a net -0.16% across two trades, but this masks the divergent outcomes: one trade hit stop loss for -4.31% (-2.2% P&L), while the other captured take profit for +4.15% (+2.2% P&L). This bipolar performance reflects BTC's role as both market leader and volatility source during extreme fear conditions.
Notably, there were no clear "worst performers" in the traditional sense, as all symbols showed either positive or modestly negative total returns. ETH/USDT registered -2.22% on a single trade that hit stop loss, while SOL/USDT showed -3.78% across six trades. The absence of catastrophic losses speaks to the system's defensive positioning during difficult market conditions.
## Worst Performers
While no symbol produced disastrous results, SOL/USDT's -3.78% performance across six trades warrants examination. The trade log reveals a pattern of promising positions that gave back substantial profits: one SOL short showed a peak gain of +4.8% before exiting at just +0.14% after giving back 96% of profits. Another SOL trade gave back 79% of profits from a +4.8% peak before exiting at +1.03%. These patterns suggest SOL exhibited particularly sharp reversals that challenged the system's exit timing.
The ETH/USDT single trade loss of -2.22% resulted from a stop loss hit at 2027.11, just above the 2025.00 trigger level. This trade exemplifies the tight margins in current market conditions, where small price movements trigger exits.
## AI Accuracy This Week
The most alarming data point this week is the uniform failure across all three AI sources. The rules engine, ML model, and LLM (Claude) each achieved only 5.6% accuracy—just 1 correct prediction out of 18 attempts. This represents a systemic breakdown in predictive capability during extreme fear conditions.
Several factors likely contributed to this failure: First, extreme fear readings (Index: 9) create irrational market behavior that challenges statistical models. Second, the "trending" regime distribution (3 of 4 symbols) combined with high volatility creates whipsaw conditions that confuse trend-following systems. Third, the concentration in just four symbols limited the system's ability to diversify away from poor predictions.
The trade log reveals that successful outcomes came primarily from risk management (partial closes, profit protection) rather than accurate directional calls. The system's positive P&L despite 94.4% prediction error rate demonstrates that survival in extreme conditions depends more on position management than forecasting accuracy.
## Market Regime Shifts
The current regime distribution shows "trending" dominating with 3 of 4 symbols, while only 1 exhibits "ranging" behavior. This represents a significant shift from more balanced conditions and has important implications:
First, trending markets during extreme fear create amplified directional moves that challenge reversal-based systems. The high frequency of partial closes (triggered when trades give back 79-96% of peak profits) suggests the system is struggling to capture full trending moves.
Second, the regime consistency across symbols (BNB, BTC, ETH all trending) indicates broad market synchronization rather than idiosyncratic moves. This reduces diversification benefits and increases systemic risk.
Third, the absence of "mean reversion" or "breakout" regimes suggests the market is in a pure directional phase without clear consolidation periods. This environment particularly challenges the LLM's narrative-based analysis and the rules engine's conditional logic.
The system health score showing as N/A is concerning and may indicate regime detection issues or data quality problems during volatile periods.
## Outlook
Based on current data, several concerning patterns emerge for the week ahead. The extreme fear reading (Index: 9) historically precedes either capitulation bottoms or continued downward pressure. The uniform failure of all AI prediction sources suggests traditional analysis frameworks are breaking down in current conditions.
The system's demonstrated strength—superior risk management that turned a 33% win rate into positive returns—should be the focus going forward. However, the 94.4% prediction error rate cannot be sustained indefinitely. Several adjustments appear necessary:
First, position sizing should be reduced until prediction accuracy improves. The system is surviving on risk management alone, which works until it doesn't.
Second, the regime detection system requires examination. With 3 of 4 symbols showing "trending" but trades frequently giving back 80-95% of profits, either the regime classification is incorrect or the system's trending strategies need adjustment.
Third, the concentration in just four symbols creates unnecessary risk. Expanding the symbol universe would provide better diversification during volatile periods.
The positive takeaway is the system's defensive capabilities: turning a 33% win rate into positive returns demonstrates robust risk management. However, this cannot substitute for predictive accuracy long-term. The week ahead likely continues volatile trending conditions, requiring even tighter stops, smaller positions, and potentially manual overrides until AI prediction accuracy recovers above the 5.6% floor observed this week.
Weekly Signal Review: Extreme Fear Tests AI Systems Amid 33% Win Rate
· MARKET · WEEKLY_REVIEW · Score: +0.0 · Regime: trending · Sentiment: bullish
#Weekly Review #AI Trading #Market Analysis
MARKET Signals